Histogram in R
A histogram represents the distribution of a continuous variable and the frequency of values bucketed into ranges.
Syntax: hist(x)
Example :
#Simple Histogram
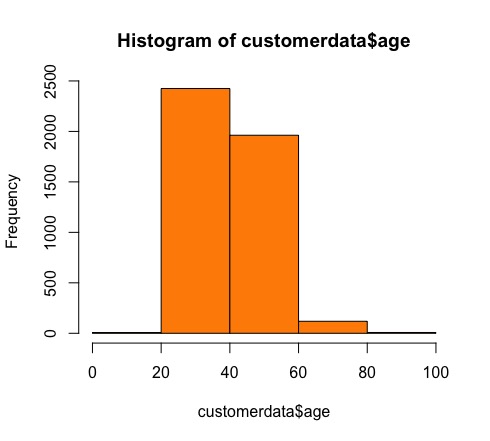
hist(customerdata$age)

#Histogram with different bin
# function break = controls the number of bin
hist(customerdata$age, breaks=4, col=”darkorange”)